Visualizer makes it easy to drill down - and up - to display information at different levels of detail and create hyperlinks to navigate directly to that information. For example, you can click on a year in a report to view data for each quarter of the year, and click on the quarter to see data for each month in the quarter.
You can create one or more custom drill paths and use them to add hyperlinks to a report. A drill path is normally associated with an attribute, so multiple attributes allow for multiple drill paths.
Drilling behavior follows this hierarchy:
- Dashboard-level drill-across links
- Report-level drill paths as described in this topic
- Space-level drill paths
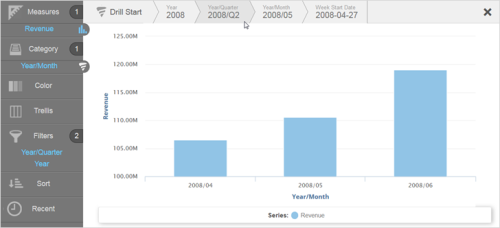
As Visualizer users click through drill paths, the nodes display across the top of reports. Drill paths create filters that apply across a dashboard. When a user clicks to activate a drill path in dashboards, the filter card for that drill node appears.
For table reports, drill paths and hyperlinks are underlined in blue. Also, hovering over a hyperlink may display the link path in the browser, depending upon the browser's support for this functionality.
Topics on This Page
Use Drilling
You can enable drilling for reports in the following ways:
- Create one or more drill paths for a particular report.
- Create drill paths and drill maps for use across the whole space.
- Click the Drill icon which displays in the Chart Builder to indicate an attribute can be drilled to show a different level of detail.
- Drill-down is not supported for pie charts.
- If you include a Visualizer chart report in a new dashboardsdashboard, a drill-across at the dashboard dashlet level overrides a drill-down defined at the chart report level.
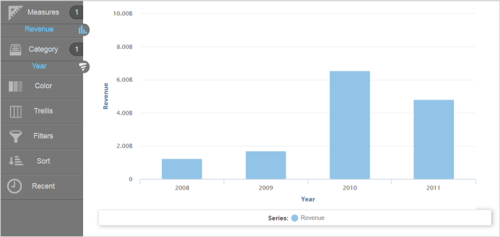
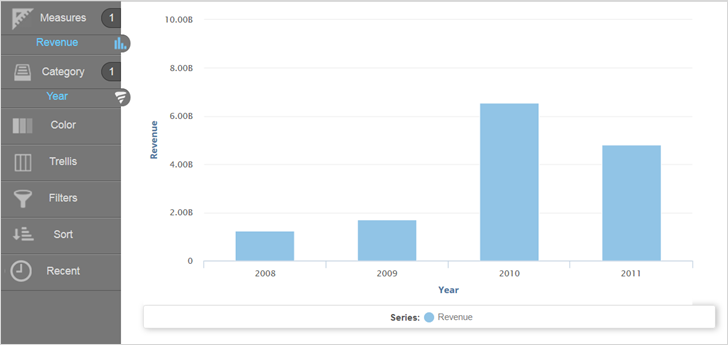
- Add a measure
and an attribute configured for drilling. The Chart Builder displays the Drill icon.
- Click
Drill. Visualizer displays the next -level attribute in the Subject Area.
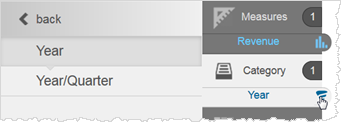
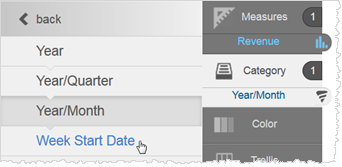
- In the Subject Area, click
on the drill-down attributes to swap out the attributes
in Chart Builder. Visualizer displays the next level down until you reach the last attribute.
- To interact
with the drillable chart, click on a chart component to start the drill
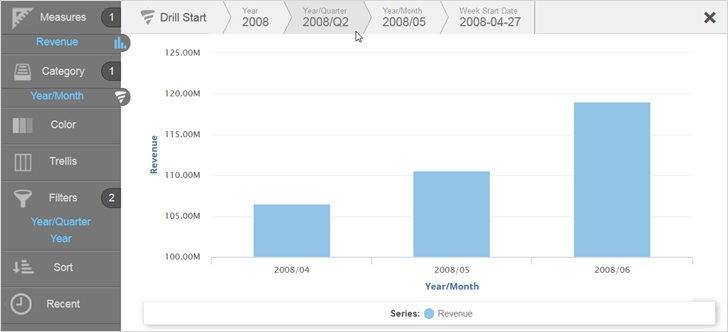
down. The drill path breadcrumbs display at the top of the chart. Chart Builder also displays the updated Filters.
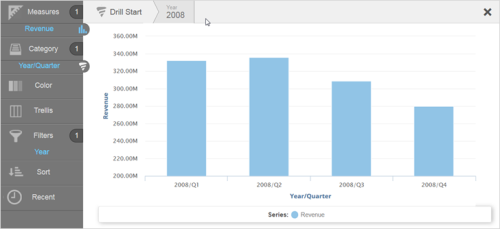
- Continue clicking on the chart to continue drilling. The breadcrumbs update. Click
a breadcrumb to return to a previous view.
- Click Save.
- Add the report to a dashboard.

Create a Report-Level Drill Path and Hyperlink
Drill paths can contain a single attribute or multiple attributes, also called nodes. A hypothetical drill path with multiple nodes can follow this path: Region → Product → Hyperlink.
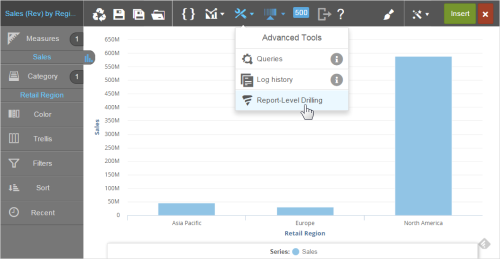
- In a Visualizer report, click Advanced Tools → Report-Level Drilling.
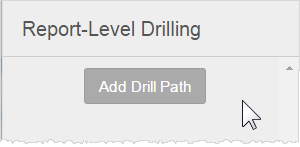
- In the Report-Level Drilling pop-up, click Add Drill Path.
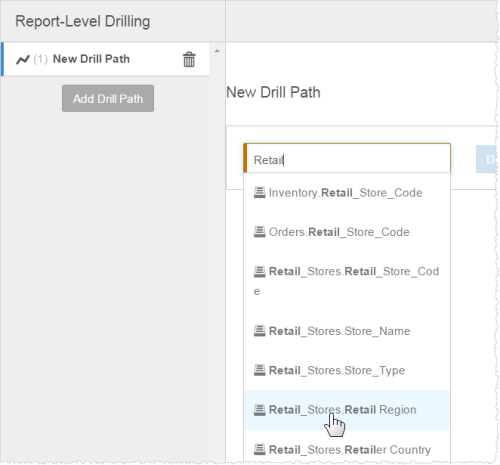
- Name the new drill path.
- In the drop-down, select an attribute.
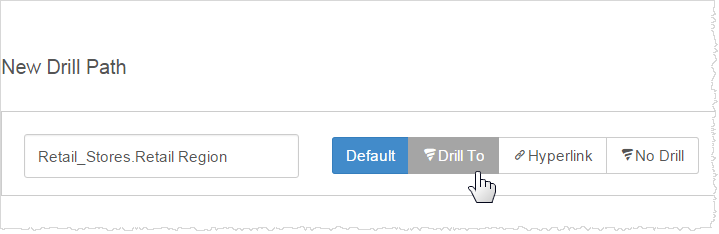
- If you want to include additional attributes in the drill path, click Drill To. Otherwise, proceed to step 7.
- Select additional attributes as needed.
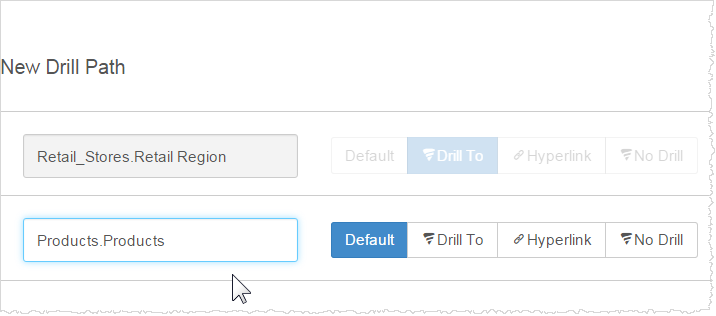
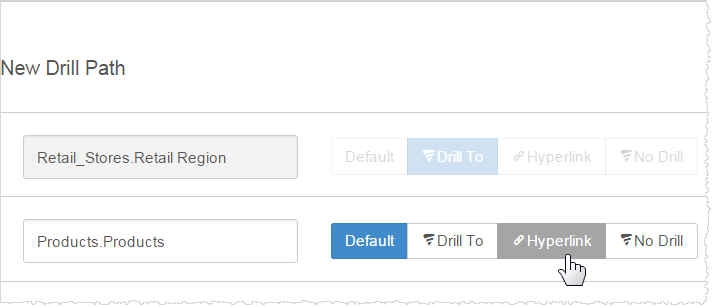
- When you are finished adding attributes, click Hyperlink for the last attribute you want to include in the drill path.
- Type the applicable URL using BQL
 Business Query Language syntax. Place the URL in single quotes.
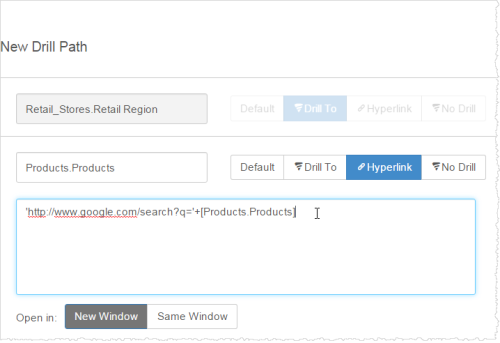
- Select New Window to open the URL in a new window or Same Window to open the URL in the same window as the report.
- Click Done to exit the pop-up.
- Click Save to save the report.
- Test the report.
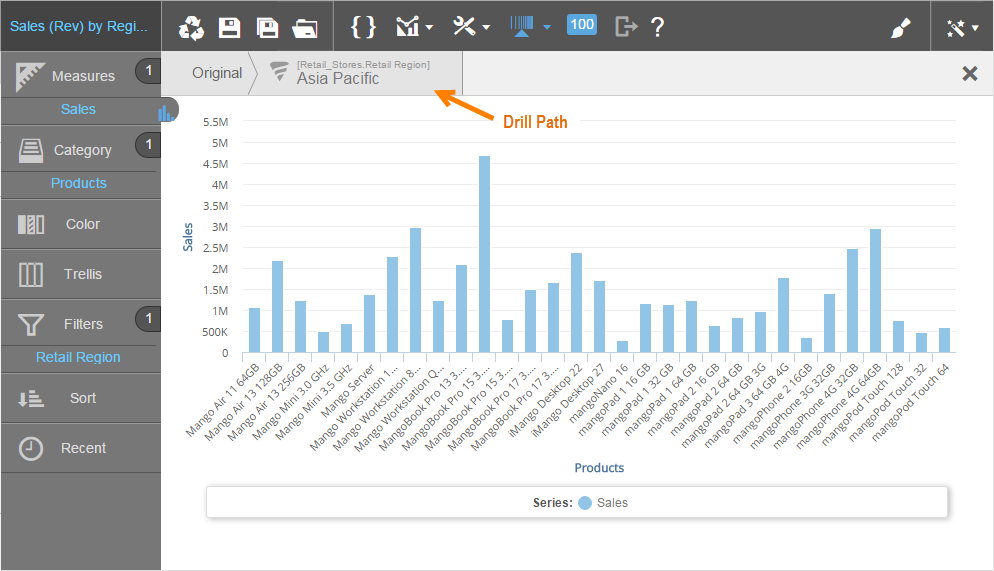
- Select a region to drill to the products for that region. You can see the drill path at the top of the report.

- Click a Product column to drill to the URL for that product.Example:

- Select a region to drill to the products for that region. You can see the drill path at the top of the report.
- Add the report to a dashboard and save the dashboard.


Disable Drilling for an Attribute
You can disable drilling for an attribute that is configured for drilling.
- From a Visualizer report, click Settings → Report-Level Drilling.
- In the Report-Level Drilling pop-up, click Add Drill Path.
- Name the new drill path.
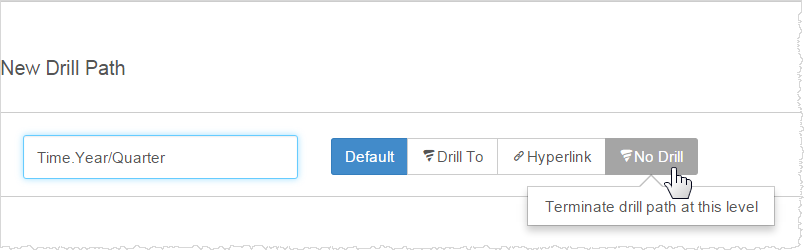
- In the New Drill Pathpop-up, select the attribute that you want to disable.
- Click No Drill.

- Click Done to exit the pop-up.
- Click Save.
- Test the report.